Let’s go on a journey with two Katahdin full sibling ram lambs and follow them as their EBVs change when their own performance is measured. Along the way I will do my best to explain why their EBVs changed at every step in the journey. We all know EBVs change, especially when you measure traits; hopefully looking at a case study helps you understand a bit better how and when EBVs can change.

The data and dates used are real and the EBVs are real as returned by NSIP/LambPlan. The names have been changed to protect the innocent.
We start with two full sibling ram lambs (let’s call them Sam and Tom) born in 2025 on the same day from the same sire and dam, born twins and raised twins by a 2-year-old ewe. I will go through measuring Birth, Weaning, Early Post-Weaning and Post-Weaning Weights, Weaning and Post-Weaning Fecal Egg Counts, Scrotal Circumference and Loin Eye and Fat Scanning. Using identical genetics (full siblings) creates a good controlled comparison, outside influence (relatives in our flock and outside flocks) will affect both of them the same way.
I will be showing and discussing changes in the following EBVs:
- BWT – Birth Weight (kg)
- MBWT – Maternal Birth Weight (kg)
- WWT – Weaning Weight (kg)
- MWWT – Maternal Weaning Weight (kg)
- PWWT – Post-Weaning Weight (kg)
- WFEC – Weaning Fecal Egg Count (%)
- PFEC – Post-Weaning Fecal Egg Count (%)
- PEMD – Post-Weaning Eye Muscle Depth (mm)
- PFAT – Post-Weaning Fat (mm)
- PSC – Post-Weaning Scrotal Circumference (cm)
- NLB – Number of Lambs Born (%)
- NLW – Number of Lambs Weaned (%)
- Index – US Maternal Hair Index
If you are not familiar with these EBVs you can learn more at EAPK – https://easternalliancekatahdins.com/education/
I will show EBVs for Sam and Tom as well as “Sam-Tom” which is Sam’s EBV minus Tom’s EBV, so that the differences in EBVs can easily be seen. “Sam-Tom” shows how much larger (positive) or smaller (negative) Sams EBVs are relative to Toms.
ΔSam shows the change in “Sam-Tom” since the previous measurement. Positive values indicate Sam’s EBV increased relative to Tom’s; negative values indicate Sam’s EBV decreased relative to Tom’s; zero indicates no change in their relative positions.
Correlations
When we measure a trait on an animal, it doesn’t just update the EBV for that specific trait, it also updates EBVs for other correlated traits. This happens because genetic correlations exist between different traits.
Positive Correlation: When one trait increases, the correlated trait also tends to increase. When one trait decreases, the correlated trait also tends to decrease.*
Negative Correlation: When one trait increases, the correlated trait tends to decrease. When one trait decreases, the correlated trait tends to increase.*
*Note: For traits like FEC where a more negative number indicates better parasite resistance, a positive correlation with another trait means that when that trait improves, parasite resistance decreases (the FEC EBV becomes more positive). Likewise, a negative correlation between parasite resistance and another trait means that when that trait improves, parasite resistance increases (the FEC EBV becomes more negative).
When we measure a trait on an animal, the genetic evaluation system uses that measurement to update multiple EBVs simultaneously. Measured traits (such as measuring birth weight) is used to update the BWT EBV as well as other EBVs that are correlated with birth weight. The correlation is between a measured trait and an EBV, not between one EBV and another EBV.
When we weigh Sam at birth, that single measurement simultaneously updates:
- Birth Weight EBV (what we actually measured)
- Weaning Weight EBV (because heavy birth weight lambs tend to be heavy at weaning)
- Post-Weaning Weight EBV (because heavy birth weight lambs tend to be heavy later too)
Pedigree EBVs: October 2024
Before Sam and Tom were born, I calculated their pedigree EBVs – the expected genetic potential based on averaging their sire’s and dam’s EBVs. Since they’re full siblings with no individual measurements yet, both lambs have identical genetic expectations.
| Sam | Tom | Sam-Tom | ΔSam | |
| BWT | 0.540 | 0.540 | 0 | 0 |
| MBWT | 0.167 | 0.167 | 0 | 0 |
| WWT | 3.544 | 3.544 | 0 | 0 |
| MWWT | 0.780 | 0.780 | 0 | 0 |
| PWWT | 6.345 | 6.345 | 0 | 0 |
| WFEC | -61.380 | -61.380 | 0 | 0 |
| PFEC | -33.230 | -33.230 | 0 | 0 |
| PEMD | 0.149 | 0.149 | 0 | 0 |
| PFAT | -0.287 | -0.287 | 0 | 0 |
| PSC | 1.313 | 1.313 | 0 | 0 |
| NLB | 5.050 | 5.050 | 0 | 0 |
| NLW | 14.250 | 14.250 | 0 | 0 |
| Index | 103.710 | 103.710 | 0 | 0 |
This identical starting point makes them perfect for comparison – any future differences in their EBVs will be due to their individual performance measurements and how those measurements update estimates of their genetic potential. EBV changes due to the performance of their relatives, both in our flock and elsewhere will affect them both equally, so the differences will only be because of their own performance.
Birth Weights: Late March 2025
Sam and Tom were born in late March. When weighed within 24 hours of birth, Sam was 1.7 lb. lighter than Tom – the first measurable difference between these full siblings.
EBVs change for many reasons, but I’m tracking only changes caused by Sam and Tom’s own measurements. Since they’re full siblings, external factors affect both equally; any differences between them reflect their individual performance.
| Sam | Tom | Sam-Tom | ΔSam | |
| BWT | 0.608 | 0.705 | -0.097 | -0.097 |
| MBWT | 0.178 | 0.178 | 0 | 0 |
| WWT | 3.645 | 3.889 | -0.244 | -0.244 |
| MWWT | 0.000 | 0.000 | 0 | 0 |
| PWWT | 6.366 | 6.632 | -0.266 | -0.266 |
| WFEC | -66.150 | -66.170 | 0.020 | 0.020 |
| PFEC | -30.100 | -30.070 | -0.030 | -0.030 |
| PEMD | 0.065 | -0.049 | 0.114 | 0.114 |
| PFAT | -0.441 | -0.597 | 0.156 | 0.156 |
| PSC | 0.000 | 0.000 | 0 | 0 |
| NLB | 5.600 | 5.600 | 0 | 0 |
| NLW | 14.400 | 14.400 | 0 | 0 |
| Index | 103.710 | 103.740 | -0.030 | -0.030 |
BWT, WWT and PWWT
Sam’s 1.7 lb lighter birth weight resulted in his BWT EBV being lower than Tom’s. Because growth traits are positively correlated, Sam’s WWT and PWWT EBVs also decreased relative to Tom – the birth weight measurement provided information to update estimates for these future growth stages.
Notice that a 1.7 lb actual difference only created a 0.097 kg (0.214 lb) BWT EBV difference. This demonstrates a fundamental principle: only a portion of performance differences are attributed to genetics – the rest is considered environmental. This concept applies to all traits throughout our journey.
MBWT and MWWT
The MWWT EBVs changed from 0.780 (pedigree) to 0.000 (displayed as zero). This isn’t because the genetic potential disappeared, but because Sam and Tom’s young parents have low accuracy MWWT EBVs that fall below the minimum threshold for display. This should resolve once we collect weaning weights and improve their parents’ accuracy.
WFEC and PFEC
Birth weight has very weak correlations with fecal egg counts, creating tiny changes in Sam and Tom’s WFEC and PFEC EBVs. These changes are practically negligible.
PEMD and PFAT
These traits show negative correlation with birth weight – Sam’s lighter weight resulted in better (higher) PEMD and PFAT EBVs. This reflects the general principle that faster growth often comes at the expense of carcass quality.
Index
Sam’s Index decreased slightly relative to Tom because it incorporates his lower WWT EBV. Unlike other EBVs, the Index is a calculated combination of multiple trait EBVs (WWT, MWWT, NLB, NLW) rather than a directly estimated genetic value.
Weaning Weights: Early June 2025
We collected weaning weight data when lambs were 40-90 days old (majority over 60 days). Important note: We don’t actually wean this early – we collect data at this age to capture the most accurate maternal influence before environmental factors become more dominant.
The gap widens: Sam weighed 3 lb. less than Tom, compared to 1.7 lb. at birth.
| Sam | Tom | Sam-Tom | ΔSam | |
| BWT | 0.620 | 0.717 | -0.097 | 0 |
| MBWT | 0.169 | 0.169 | 0 | 0 |
| WWT | 2.995 | 3.226 | -0.231 | 0.013 |
| MWWT | 0.909 | 0.909 | 0 | 0 |
| PWWT | 5.479 | 5.726 | -0.247 | 0.019 |
| WFEC | -64.110 | -64.070 | -0.040 | -0.060 |
| PFEC | -30.260 | -30.240 | -0.020 | 0.010 |
| PEMD | -0.065 | -0.182 | 0.117 | 0.003 |
| PFAT | -0.795 | -0.957 | 0.162 | 0.006 |
| PSC | 0.000 | 0.000 | 0 | 0 |
| NLB | 3.600 | 3.500 | 0.100 | 0.100 |
| NLW | 13.200 | 13.100 | 0.100 | 0.100 |
| Index | 103.520 | 103.530 | -0.010 | 0.020 |
BWT, WWT and PWWT
WWT EBV gap narrowed by 0.013 – Sam’s weaning performance exceeded expectations based on his birth weight. PWWT also improved for Sam due to positive correlation with WWT.
MBWT and MWWT
MWWT EBVs now appear (previously showed zero) because the parents’ accuracy improved with more data. Both lambs have identical values since they share the same sire and dam; they have no measurements related to MBWT and MWWT on themselves.
WFEC and PFEC
There were some minor changes to WFEC and PFEC because of small negligible correlations between weaning weight and WFEC and PFEC. The changes because of weaning weight being measured are very small and can be ignored for the most part (although it is interesting to note).
PEMD and PFAT
Sam was lighter than Tom and measuring weaning weight resulted in a 0.003 and 0.006 increase in the gap between PEMD and PFAT respectively. A small change in the scheme of things.
NLB and NLW
Well, that was unexpected! Now that we have weaning weight measured, we see that this measurement has a small impact on NLB and NLW. A small negative correlation but interesting even though small.
Index
Sam’s Index gap with Tom narrowed to just -0.010 due to improvements in WWT and NLW (positive effects) outweighing the slight increase in NLB (negative effect).
Early Post Weights & Weaning FEC: Late July 2025
We collected early post-weaning weight data when all lambs were between 90 and 150 days old (with the majority over 120 days old). We also collected fecal samples for weaning fecal egg counts once our lambs had sufficient parasite challenge to achieve an average over 500 eggs per gram. We collected fecal samples during the WWT age window but sent them out and only had results back by the time we collected early post weaning weights, so we submitted them in the same data run.
Sam weighed 13 lb. lighter than Tom (a larger difference than expected), but Sam performed exceptionally well on parasite resistance with 550 fewer eggs per gram than Tom.
Note: This comparison is more complex because it includes new data for two traits simultaneously – weaning fecal egg count and early post-weaning weight.
| Sam | Tom | Sam-Tom | ΔSam | |
| BWT | 0.558 | 0.655 | -0.097 | 0 |
| MBWT | 0.166 | 0.166 | 0 | 0 |
| WWT | 2.613 | 3.002 | -0.389 | -0.158 |
| MWWT | 0.923 | 0.923 | 0 | 0 |
| PWWT | 4.538 | 5.278 | -0.740 | -0.493 |
| WFEC | -78.820 | -46.110 | -32.710 | -32.67 |
| PFEC | -53.570 | -6.960 | -46.610 | -46.59 |
| PEMD | -0.031 | -0.137 | 0.106 | -0.011 |
| PFAT | -0.744 | -0.918 | 0.174 | 0.012 |
| PSC | 0.000 | 0.000 | 0 | 0 |
| NLB | -0.600 | 5.700 | -6.300 | -6.400 |
| NLW | 8.700 | 14.000 | -5.300 | -5.400 |
| Index | 102.670 | 103.610 | -0.940 | -0.930 |
BWT, WWT and PWWT
The gap between Sam and Tom’s growth EBVs increased significantly. Sam’s PWWT EBV fell further behind Tom’s, primarily driven by the 13 lb. weight difference at early post-weaning measurement. This measurement also caused Sam’s WWT EBV to decline relative to Tom’s due to the positive correlation between early post-weaning weight and WWT.
Note: Weaning fecal egg count has a very small negative correlation with WWT and PWWT, but this impact is negligible compared to the early post-weaning weight impact.
MBWT and MWWT
No changes.
WFEC and PFEC
Before testing, Sam’s WFEC was only marginally better than Tom’s (difference of 0.040). After measuring actual weaning fecal egg counts, Sam’s advantage expanded dramatically to 32.710 points. Sam achieved a strong WFEC of -78.820 compared to Tom’s -46.110.
PFEC was also updated due to the very strong positive correlation between WFEC and PFEC, with Sam gaining a substantial advantage.
PEMD and PFAT
Both traits showed modest changes due to correlations with the measured traits:
- Weaning Fecal Egg Count: Small negative correlation with PEMD, larger negative correlation with PFAT
- Early Post-Weaning Weight: Small positive correlation with PEMD, negative correlation with PFAT
The net effect slightly favored Sam in both traits.
NLB and NLW
The most dramatic change occurred in reproductive trait EBVs, with Sam falling significantly behind Tom. This change was overwhelmingly driven by the weaning fecal egg count measurement rather than the weight data.
The correlation works as follows: improved parasite resistance (more negative WFEC) correlates with reduced reproductive performance. Sam’s WFEC improved from -64.110 to -78.820, while Tom’s declined from -64.070 to -46.110, resulting in Sam’s NLB and NLW EBVs dropping by 6.4 and 5.4 points respectively, compared to Tom’s. The gap between Sam and Tom widened dramatically – Sam went from having a 0.1 point advantage in both NLB and NLW to being 6.3 and 5.3 points behind Tom respectively.
Index
Sam’s Index fell to 0.940 points below Tom’s, representing a decline of 0.930 points from the previous measurement. This change was driven by the combined effects on WWT, NLB, and NLW, with the NLW impact being the largest contributing factor.
Post-Weaning FEC, SC & Scanning: Early September 2025
We collected post-weaning weight at the time of ultrasound scanning since loin eye and fat depth measurements are weight-adjusted and require a concurrent weight measurement.
Technical note: Based on experience, when collecting both early post-weaning and post-weaning weights, PWWT accuracy doesn’t change and the PWWT EBV calculation uses only the first post-weaning weight submitted (whether early or standard post-weaning).
We collected our second fecal egg count during the early post weaning time period, but only had results back in time to submit it in the same data run as post weaning data.
Performance Summary:
- Growth: Sam caught up significantly – now only 1 lb. lighter than Tom (vs. 13 lb. difference previously)
- Parasite Resistance: Sam maintained his advantage with 600 fewer eggs per gram than Tom
- Reproductive: Sam’s scrotal circumference was 2 cm smaller than Tom’s
- Carcass Quality: Identical loin eye depth; Sam had 0.9 mm more fat than Tom
Note: PSC (scrotal circumference) EBVs now appear for both lambs since we have direct measurements with sufficient accuracy.
| Sam | Tom | Sam-Tom | ΔSam | |
| BWT | 0.521 | 0.644 | -0.123 | -0.026 |
| MBWT | 0.168 | 0.171 | -0.003 | -0.003 |
| WWT | 2.692 | 2.982 | -0.290 | 0.099 |
| MWWT | 0.929 | 0.940 | -0.011 | -0.011 |
| PWWT | 4.843 | 5.355 | -0.512 | 0.228 |
| WFEC | -88.010 | -51.970 | -36.04 | -3.33 |
| PFEC | -77.740 | -24.290 | -53.45 | -6.84 |
| PEMD | -0.276 | -0.442 | 0.166 | 0.060 |
| PFAT | -0.156 | -0.678 | 0.522 | 0.348 |
| PSC | 1.200 | 1.457 | -0.257 | -0.257 |
| NLB | -1.500 | 5.700 | -7.200 | -0.900 |
| NLW | 8.000 | 14.200 | -6.200 | -0.900 |
| Index | 102.560 | 103.660 | -1.100 | -0.160 |
BWT, WWT and PWWT
Despite Sam’s improved physical performance (catching up 12 lbs), the growth EBV changes were driven entirely by correlations with newly measured traits, not the weight difference itself. While Sam did catch up physically (1 lb vs 13 lb difference), the PWWT EBV calculation uses only the first post-weaning weight submitted.
- BWT: Declined due to negative correlations with loin eye depth and fat, partially offset by positive correlation with post-weaning fecal egg count and scrotal circumference
- WWT: Improved due to positive correlation with post-weaning fecal egg count and scrotal circumference, despite negative correlations with carcass traits
- PWWT: Improved due to positive correlations with post-weaning fecal egg count, loin eye depth and scrotal circumference, offset by negative correlation with fat
MBWT and MWWT
Sam’s MBWT and MWWT relative to Tom’s declined by a small amount, primarily driven by Sam’s smaller scrotal circumference (negative correlation) and higher fat content (negative correlation). Minor positive effects from loin eye depth and post-weaning fecal egg count also contributed.
WFEC and PFEC
Sam’s WFEC and PFEC continued improving with his better post-weaning fecal egg count measurement and due to negative correlation with his higher fat depth. Additional minor correlations with loin eye depth and scrotal circumference provided smaller effects.
PEMD and PFAT
PEMD: Sam’s advantage increased despite identical scanning measurements. This occurred because:
- Sam achieved the same loin eye depth while being 1 lb. lighter
- Positive correlation between loin eye depth and fat depth
PFAT: Sam’s higher fat measurement (0.9 mm more) directly drove his improved PFAT EBV, with additional contributions from other correlated traits.
PSC
Sam’s 2 cm smaller scrotal circumference translated directly into a lower PSC EBV (-0.257 difference).
Why measure scrotal circumference? This trait provides valuable selection information for:
- Strong correlations with MBWT, MWWT, WWT, PWWT, NLB, NLW and Index
- Early maturity in replacement ewe lambs
- Breeding soundness evaluation for ram lambs
NLB and NLW
Both declined by 0.9 points relative to Tom, primarily driven by the negative correlation with Sam’s smaller scrotal circumference.
Index
Sam’s Index declined by an additional 0.160 points, reflecting the net effect of all EBV changes that contribute to the Index calculation. While Sam showed improvement in several individual traits, the reproductive trait penalties outweighed the gains.
Key Takeaways
If your brain feels like it just got tangled in correlations, don’t panic!
The good news: Correlations are already built into the EBVs you receive. There’s no additional work needed to use them – they’re part of the genetic parameters used to calculate EBVs. When you measure one trait (like weaning fecal egg count), it impacts many other traits. Think of it as getting more information about other traits for free.
These correlations are real: They’re not theoretical guesses about biological processes. They’re based on actual measurements from hundreds of thousands of Katahdin sheep. These observations tell us that when trait X increases, we can expect trait Y to increase (positive correlation) or decrease (negative correlation). This information combines with measurements from related animals to provide a more complete picture of an animal’s genetic potential.
Context matters: Correlations range from -1 (strongest negative) to +1 (strongest positive), this indicates the strength of the relationship. While statisticians might call a correlation “small,” a 32-point WFEC improvement causing a 5-point NLW decrease can feel quite significant when it’s your animal! I don’t have access to the exact genetic correlation values, but the correlations between EBVs provide a good approximation.
Remember Sam and Tom’s journey: Their story shows how each new measurement revealed more about their genetic potential, sometimes in unexpected ways. Sam’s superior parasite resistance came with trade-offs in reproductive traits, while Tom’s growth advantage told its own story about genetic strengths and weaknesses.
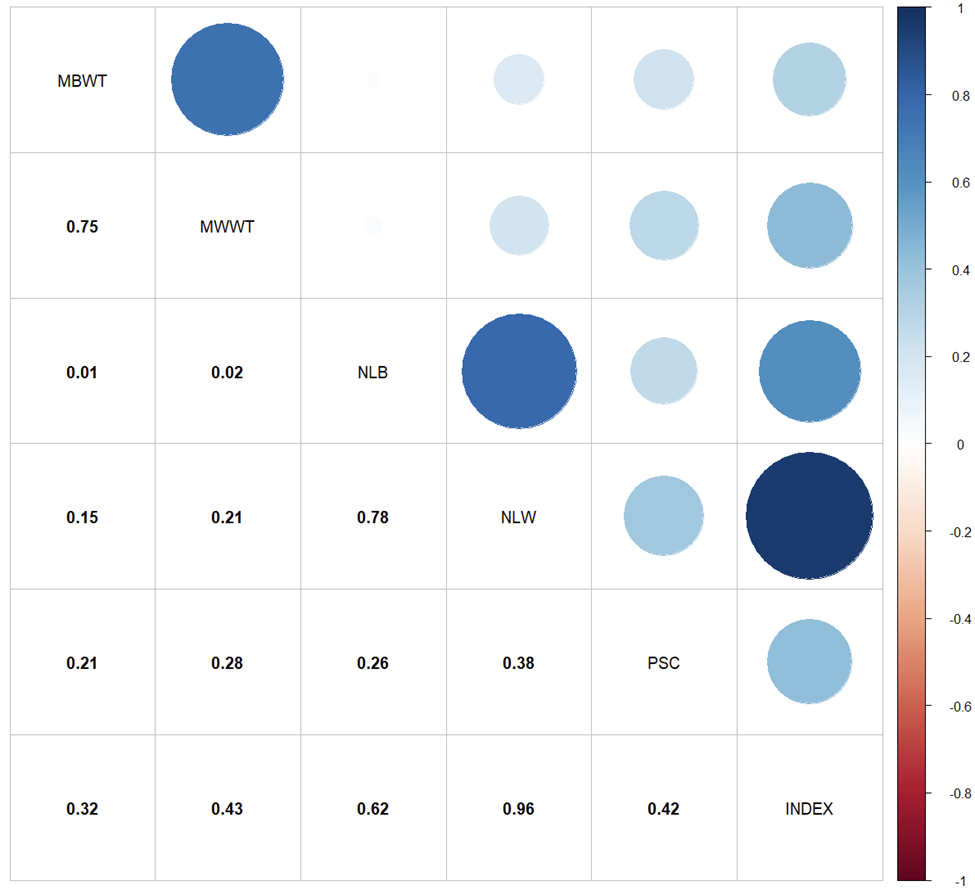
The charts below show some of the correlations (only showing up to 2 decimal positions). The actual value of the correlation changes over time and based on the size of the sample being evaluated. The interesting aspect for most people interested would be the direction (positive or negative) as well as the relative magnitude.
Reading the Charts:
The EBV names are on the diagonal of the grid.
To get the correlation between two EBVs you follow the one EBV up or down the column to the row where the other EBV is on the diagonal and read the value in that cell (or the colored circle).
Lower diagonal of the grid shows the estimated correlation value and the upper diagonal of the grid shows the estimated correlation as a circle (size of the circle shows magnitude and the value is shown as color intensity ranging from -1 to 1, negative values use the red gradient while positive values use the blue gradient).
Examples:
- Correlation of WFEC with PFEC is 0.86
- Correlation of WFEC with NLB is 0.28 and WFEC with NLW is 0.17
- Correlation of BWT with WFEC is -0.02
- Correlation of NLB to NLW is 0.78
Typical EBVs:
PSC and Maternal EBVs:
By: Etienne Richards, Gibraltar Farm, EAPK Member
![]()
